Iconnote
Iconnote was a research project by Ansgar Vollmer at IAMAS, Institute of Advanced Media Arts and Sciences, Japan in 2004.
The research was to develop a web portal for archiving and sharing of pictograms and icons. The web portal Iconnote offers comprehensive services for the archiving and sharing of pictograms, icons, graphical symbols etc..
Iconnote maintains a growing database of pictograms, covering a wide field of applications and styles. Each pictogram is analyzed following clearly laid out semantic, syntactic and pragmatic criteria, pioneered by Jacques Bertin in his »Semiology of Graphics« and further refined by Yuri Engelhardt in »Language of Graphics«.
Project
The Iconnote Project is an attempt to classify pictograms based on their visual attributes and meanings.
The goal of this project was to develop the theoretical framework for a pictogram web portal.
Pictograms are graphic symbols that present information such as instructions or warnings in a compact visual form; pictograms may also include typographic elements. Despite many existing guidelines for pictograms, it is often difficult to determine their exact meaning.
With the help of Semiotics, the science of signs and symbols, it is possible to analyze pictograms and device classification schemes for their handling in databases.
Research Background
This part shows an outline of the research background for the analysis of pictogram characteristics and attributes. This is needed for developing a practicable input and retrieval system.
The theoretical background is based on the thesis of theory of graphic semiotics, first formulated by Jacques Bertin and the recent thesis of »Language of Graphic« by Yuri Engelhardt, Amsterdam, 2002. All citations of Yuri Engelhardt are marked with the acronym (YE).
Potential of Graphics
Graphics play an increasingly important role in our daily life. New technologies for production, reproduction and distribution are some of the main reasons for that.
Graphics are very usefully for communication as they are more illustrative than text. Graphics can contain more complex information than text in highly compressed form.
![]()
The example below shows a description of a square in three variants.
The first part shows a graphical or geometrical representation.
The second part is an arithmetic expression and the third is a textual description. This example shows the difference between figurative and abstract formulation. The arithmetic and text variations make it difficult to comprehend the exact particular features of ‘square’.
This simple example illustrates convincingly, why we use graphics to display complex information.
![]()
Graphics can be studied as a ‘visual language’ following similar rules than spoken or written language. Using Semiotics, a visual language to understand its elements, how they are relat to each other, and how it is put into use. These three dimensions of analysis are called: Semantics, Syntactics, and Pragmatics.
The figure below shows the three different dimensions of Semiotics. The three examples will explain this at a traffic sign.
In the following part I will try to summarize the notion of graphic semiotics by Yuri Engelhardt.
Semiotics
In a graphic representation we define the type of correspondence as the type of relationship between what is shown and what is meant, the ‘signifying’ and ‘signified’.
| what is shown | what is meant |
Three Types of graphic notation can be recognized. Each of these notations builds on the graphic objects and its visual and formal attributes.
![]() Literal
Literal
![]() Metaphorical
Metaphorical
![]() Conventional
Conventional
Each of these notations builds on the graphic objects and its visual and formal attributes.
literal: what is shown is based on similarity to the physical object or physical structure that is meant, or on similarity to a prototypical example of the kind of physical object that is meant.
metaphoric: based on a supposed analogy between what is shown and what is meant, this may concern either a shared functional characteristic or a structural analogy.
conventional: what is shown seems to stand for what is meant by pure convention, although in many cases the current users of the concerned representation may simply not be aware of the fact that the representation originated involving one of the other types of correspondence.
metonymic: based on a mental association due to the fact that there is a relationship of physical involvement between what is shown and what is meant, e.g. what is shown is a part of or is a possible result of what is meant, or in some other way it plays a role in what is meant.
Mode of Expression
Concerning its mode of expression, an elementary graphic object may be:
![]() a pictorial object ranging in character from realistic to abstract representation.
a pictorial object ranging in character from realistic to abstract representation.
![]() a non-pictorial object such as abstract shapes, words and numbers
a non-pictorial object such as abstract shapes, words and numbers
»An elementary graphic object is regarded as a non-pictorial object if it involves no literal correspondence- neither to its intended referent nor to its intermediary referent. In other words, a non-pictorial object does not function as a depiction of a physical object or scene .It may be an abstract shape, a word or a number.« (YE p.119)
Semantics
The semantic analysis of the meaning for a graphic representation can fallow the same structure of the syntactic alanalysis.
The interpretation of a graphic object maybe
![]() an interpretation of it as an elementary graphic object, or
an interpretation of it as an elementary graphic object, or
![]() an interpretation of it as a composite graphic object, constructed from:
an interpretation of it as a composite graphic object, constructed from:
![]() the interpretations of the graphic components that are part of it, and
the interpretations of the graphic components that are part of it, and
![]() the interpretations of the graphic relations in which these graphic components are involved, which may partly be based on the interpretation of graphic space in witch they are arranged.
the interpretations of the graphic relations in which these graphic components are involved, which may partly be based on the interpretation of graphic space in witch they are arranged.
»In this way the interpretation of complex graphic representation may be derived through several nested levels of interpreting constituting graphic objects, and interpreting the way in which these are combined.« (YE p.16)
Type of correspondence
![]() Interpretation of graphic components and graphic relation between the different graphic components and graphic elements
Interpretation of graphic components and graphic relation between the different graphic components and graphic elements
![]() what is shown and what is mean.
what is shown and what is mean.
The types are literal, metaphoric, metonymic, rebus-base,and arbitrary-conventional.
Mode of expression (Classification)
![]() pictorial elements (from realistic to schematic pictures)
pictorial elements (from realistic to schematic pictures)
![]() non-pictorial elements (abstract shapes, words and numbers)
non-pictorial elements (abstract shapes, words and numbers)
Information roles of graphic objects
![]() information elements
information elements
![]() referents elements
referents elements
![]() decoration elements
decoration elements
Graphic Syntax
The graphic syntax describes the arrangement of the graphic elements. Yuri Engelhardt says, that a graphic representationcan be regarded as an expression of a visual language, and can beanalyzed in regards to its graphic syntax and its interpretation.
Engelhardt divides a graphic representation into single graphic elements and space. He calls this the ‘spatial structure’. I will however use the term ‘graphic component’ instead of Yuri Engelhard’s term ‘graphic object’. The reason for this change of terminology is that Yuri Engelhard’s thesis is looking especially at information graphics, such as charts and diagrams. The term ‘component’ has a more generic connotation making it easier to relate the findings of this research to related studies in other fields. The ‘graphic components’ is the smallest discernable unit in to given context of analysis.
While Yuri Engelhardt considers a pictogram as a complete graphic unit, I try to formulate a more scalable approach which should facilitate classifier’s context rather than some absolute authority.
The benefit of Yuri Engelhardt’s proposal is certainly that it is easier to be understood by the user. In my approach, I needed to find a structure which could easily be matched with the qualities of object oriented database programming. Input and retrieval are based on components of varying levels in focus. Such flexibility would for example be required by a patent office which has to deal with the administration of logos and trademarks.
Yuri Engelhardt says that every ‘graphic object’ can be nested into another ‘graphic object’ within a given spatial structure. Thus the arrangement of ‘graphic objects’ is constituting the syntax of graphics.

In the special case of pictograms, I consider each as a complete unit, made up of a set of graphic components. A pictograms is the parent unit of different ‘graphic components’ which them selves are parent units of ‘graphic elements’.
The relationship of these parts to each other and the pictogram as a complete sign itself defines the syntax of this pictogram.
Syntactic Attributes
Graphic Space
The graphic space is the medium in which graphic objects and relation ‘live’, but it also affords a mental construction. Graphic elements/components are often perceived as occupying different layers. The front most layer attracts the main attention.

This layering effect can be used to support the imagination. In the picture below the river flows clearly underneath the road. The street becomes ‘a bridge’.
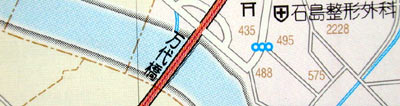
The graphic space is divided in different visual layers.
Yuri Engelhardt categorizes them as:
![]() labels
labels
![]() point locatorand connectors
point locatorand connectors
![]() line locator
line locator
![]() volume andsurface locator
volume andsurface locator
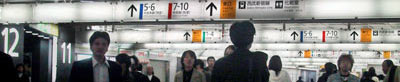
In the illustration below, the map of a train station has been analyzed to show these categories.
Graphic Objects
A graphic object may be a composite graphic object itself, or it may be an elementary graphic object.
The figure below is adapted from the thesis of Yuri Engelhardt. It has been modified for this paper in four different variations that pictograms can appear.
Another way to analyse pictograms is to list the ‘morphemes’they are made of. ‘Morphemes’ appear in two variations: ‘free morphemes’ or ‘bound morphemes’

In the example of the Non-Smoking sign, the cigarette part can be regarded as ‘free morphemes’, while the smoke or the red cross-out are ‘bound morphemes’; only in direct combination with the cigarette part they gain their respective significance.
Visual Attribute
Visual attributes describe position, orientation, size, shape, color, and texture. They can be divided in two groups. Yuri Engelhardt calls these spatial attributes and area fill attributes. This figure shows the simplified criteria for visual attributes of pictograms.
Syntactic Structure
»The syntactic structure of a composite graphic object is a set of graphic relations in which its constituent graphic objects are involved.«
(YE p.30)
Spatial object-to-object relations can be classified:
The syntactic structure of graphic representation may contain several dimensions and aspects.
This is an outline of the theoretical background of Iconnote research.

Ansgar Vollmer © 2004